
And how the FCC National Broadband Map Impacts the BEAD Program.
By: Zac Byrd, Marketing Associate & Hailey Farrow, Marketing Manager on behalf of CostQuest Associates.
The FCC released the second National Broadband Map on May 30th, 2023, as another stride forward in their effort to produce the most accurate broadband map in United States history. The updated map follows the initial ‘pre-production draft’ from November 2022, which was the starting point for generating a National Broadband Map that reflects broadband service availability at the individual location level. With the new updates to the National Broadband Map, there is now a better understanding of where the gaps in connectivity exist, to help strategically target broadband funding across the country to connect unserved and underserved communities with high-speed broadband internet.
NTIA has communicated that the second version of the National Broadband Map will be used as the basis for the NTIA’s allocations to States and Territories for the BEAD funding program.
The map is now comprised of:
- Fabric Version 2 (V2) Locations
- Service Availability data as of December 31. 2022, that was filed into the Broadband Data Collection (BDC) by March 1st, 2023.
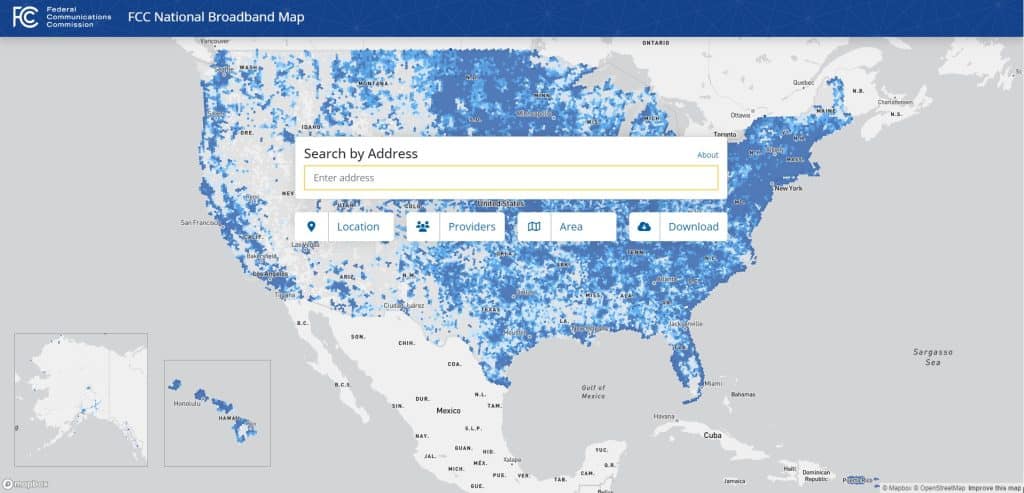
Source: FCC National Broadband Map
According to the FCC’s Press Release, with this new mapping update, the FCC found “more than 8.3 million U.S. homes and businesses lack access to high-speed broadband.”
Below is a deeper dive into what has changed in the second version of the National Broadband Map, what the FCC has learned so far in their mapping process, and how the new mapping update will affect NTIA’s BEAD program.
National Broadband Map Version 1 vs. Version 2
The first version of the National Broadband Map released in November of 2022, was only just a starting point in the grand effort of creating the U.S.’s first-ever location-level National Broadband Map. In the FCC’s release, the FCC Chairwoman Jessica Rosenworcel explains, “For context on how much more granular this is than what came before, in our current mapping effort the Commission identified over 114 million locations where fixed broadband could be installed compared to data from just 8.1 million census blocks in our prior maps. We’ve learned a lot over the past few months, and there’s, even more, to learn from the new National Broadband Map itself.”
The FCC’s May press release also explains 4 key things they’ve learned thus far in the national broadband mapping process:
1. The challenge process is a powerful tool to improve accuracy
The FCC says they have reviewed challenges to service availability data for over 4 million locations, with over 75% of those challenges already being resolved and the majority have led to updates in the data on the map showing where broadband is available. The second version of the map also reflects 1 million new Broadband Serviceable Locations compared to the November 2022 pre-production draft. According to the FCC, “this net change reflected both additions and subtractions from the Fabric – the FCC added nearly 3 million locations while removing nearly 2 million for reasons ranging from updated data to the use of more sophisticated tools to identify and eliminate structures like garages and sheds. Version 2 of the National Broadband Map also identifies an additional 330,000 unserved locations.
2. Community collaboration is key
The FCC stated, “Our mapping team has met individually with representatives from every state at least once, and, in total, hosted over 200 individual sessions with state, local, and Tribal governments. These discussions were crucial to helping all stakeholders understand what we were showing on the map, how to submit—and respond to—challenges, and how this first-of-its-kind map could be improved.”
3. Data quality tools are essential
The FCC explains that “Beyond the challenge process, the FCC has built automated checks into the new system to validate submissions from internet providers.” The FCC’s staff uses verification and enforcement tools to verify the accuracy of ISP’s service availability filings. These new data quality processes led to “updates to over 600 submissions from providers and a clearer picture of broadband availability in every state and territory.”
4. Map improvements do not stop here, and the map will continuously become more accurate
It’s important to note, the first map was not subject to challenges made by consumers, states, localities, Tribes, and other stakeholders. These challenges will now be present on new versions of the map, along with other enhancements that have been made to the data.
The National Broadband Map is designed to continuously update and evolve even after the BEAD program allocations are announced. The FCC plans to provide updated versions of the Fabric and provider-reported availability data every six months, ensuring the map remains relevant and reflective of the changing connectivity landscape. The FCC will continue to accept challenges and feedback from stakeholders every single day for further improvements to the map.
In addition, the NTIA clarifies, “states and territories, with input from eligible stakeholders, will have the ability to make more precise decisions about the locations they will fund using not just the FCC National Broadband Map, but also other sources reflecting the availability of Internet service.”
To help you keep up with the updates to the map, below is a timeline the FCC posted to explain the National Broadband Map 2023 updates, and what data versions are included:

Source: FCC Broadband Data Collection
NTIA releases guidance on how the FCC National Broadband Maps impact the BEAD Program
In May 2023, the National Telecommunications and Information Administration (NTIA) released guidance on how the FCC National Broadband Map will impact the IIJA’s BEAD program. In NTIA’s release, NTIA communicated, that the new version of the National Broadband Map will be used as the basis for the NTIA’s allocations to States and Territories for the BEAD funding program.
As of May 2023, the NTIA stated that they are preparing to notify states and territories of their allocation amounts under the BEAD program. After these notifications have been made, states and territories will have 180 days to submit their initial proposals. The NTIA’s goal is for allocation announcements to be made by June 30th, 2023.
In NTIA’s release, they also explained that between Versions 1 and 2 of the Fabric, there was a marginal increase in Broadband Serviceable Locations, from 113 million to 114 million locations. This is about a 1% net increase in the total number of Broadband Serviceable Locations nationwide.
NTIA explains these updates indicate three things to them:
- “The changes between version 1 and version 2 of the Fabric were relatively modest, and we can expect that changes between future versions of the FCC map will likely continue to be modest.”
- “These modest changes go both ways. States, territories, and the District of Columbia (“Eligible Entities”) could gain or lose locations from version to version. “
- “If the total changes to the number of Broadband Serviceable Locations is modest, it is likely the impact to the allocation amount is modest as well, because the key variable in the BEAD allocation formula is the number of unserved locations in a state or territory relative to the total number of unserved locations nationwide.”
Final thoughts
The FCC’s second release of the National Broadband Map marks a major milestone toward the goal of achieving universal high-speed internet connectivity in the United States. In the quest for continual improvement, the map will continue to evolve and be updated regularly (bi-annually for the Fabric locations and BDC Service Availability data, and when service availability challenges to the map are adjudicated) to remain a reliable resource in the changing landscape of connectivity. While the National Broadband Map is not perfect, it is still quite good and a big step forward.
Now that we have an understanding of service availability for over 114 million locations, and a modest 1% net increase of total locations between Version 1 and Version 2 of the map, this updated version of the map provides a much more precise understanding of broadband service availability than we’ve ever had before, which will help target funding to connect underserved and unserved communities and pave the way for a more connected future.
Be sure to check out the FCC’s and NTIA’s public releases (linked below) regarding the second version of the National Broadband Map for more information.
Sources
Disclaimer
This communication does not reflect the opinion or the policy of the FCC or NTIA. The FCC or NTIA is not responsible for the information or views in this communication and is not responsible for the accuracy, completeness, or timeliness of such information or views.