By: Hailey Farrow, Marketing Manager, on behalf of CostQuest Associates.
Each version of the National Fabric and Broadband Data Collection (BDC) data changes incrementally due to various factors. These factors include progress on broadband expansion efforts, new housing developments, continuous process improvements, and data challenges from the FCC’s Broadband Data Collection.
Current and future iterations of the data continue to give us a granular look at the served, underserved, and unserved locations and allow us to track the progress of broadband expansion efforts across the U.S.
This analysis discusses the key changes between Version 3 and 4 of the National Fabric and BDC Service Availability data.
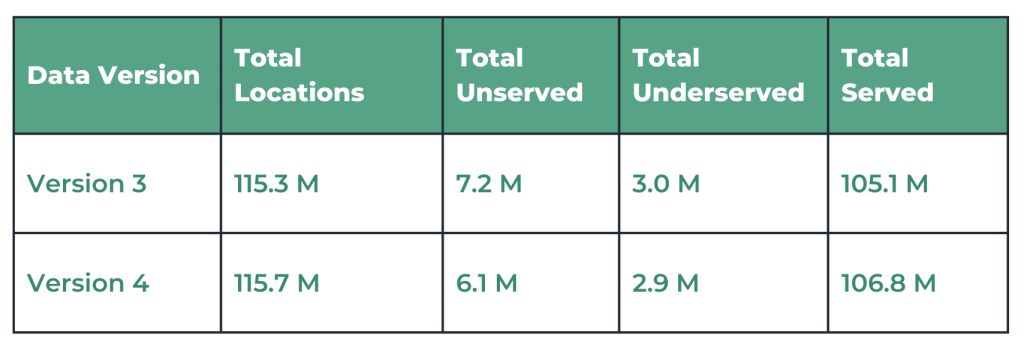
The most significant difference in Version 4 is the -16% decrease in unserved Broadband Serviceable Locations (BSLs). The data shows 6.1 million unserved locations in Version 4 compared to 7.2 M in the previous version.
About the Fabric & BDC Version 3 & 4 datasets
Version 3 is data as of June 30, 2023:
Fabric Locations (Released on June 30, 2023) + BDC Service Availability (ISP coverage data as of June 30, 2023)
Version 4 is data as of December 31, 2023:
Fabric Locations (Released December 31, 2023) + BDC Service Availability (ISP coverage data as of December 31, 2023)
Changes in Broadband Serviceable Locations
Overall, in Version 4, there was an increase in the total number of Broadband Serviceable Locations.
In Version 4, there are 115.7 M Broadband Serviceable Locations compared to 115.3 M in Version 3.
BDC Service Availability Changes: Unserved, Underserved, and Served
The number of unserved, underserved, and served Broadband Serviceable Locations all decreased from Version 3 to Version 4.
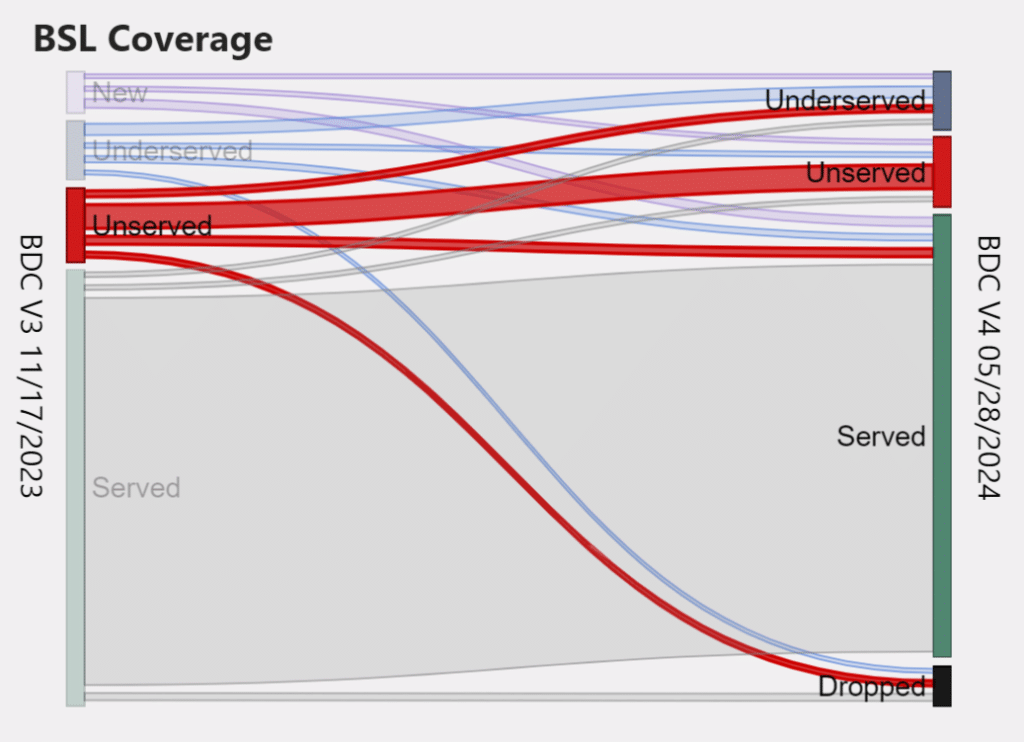
Unserved
The number of unserved locations in Version 4 is 6.1 M compared to 7.2 M in Version 3.
Of the Unserved locations in Version 3:
• 540 K moved to underserved in Version 4
• 1 M moved to served in Version 4
• 269 K dropped in Version 4
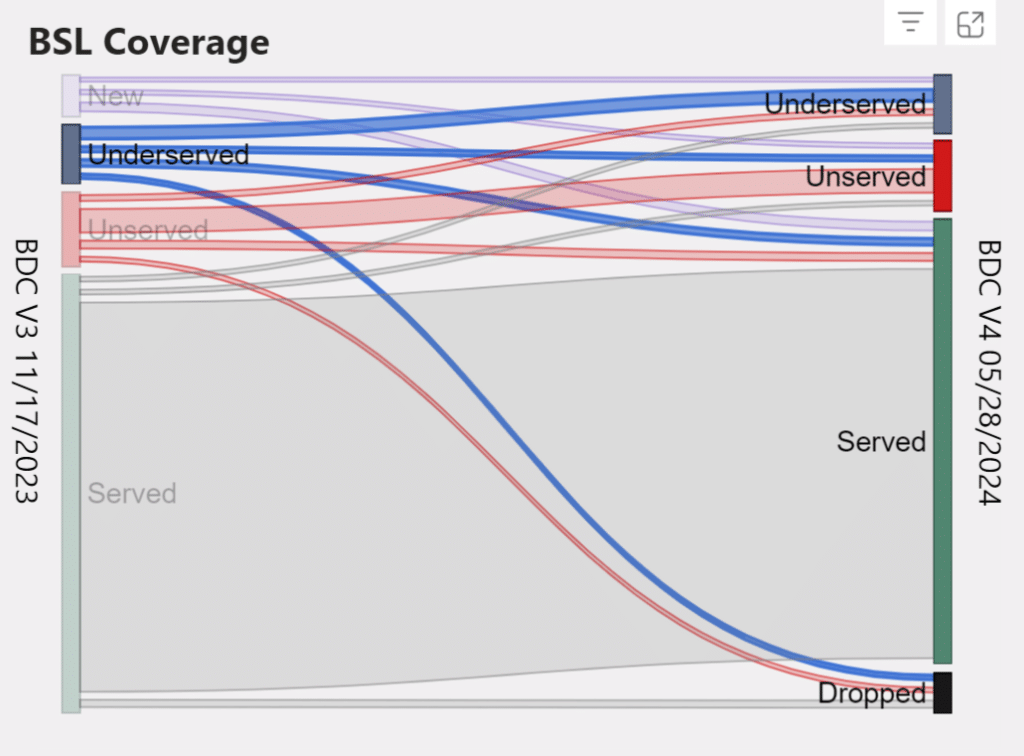
Underserved
In Version 4, the number of underserved locations is 2.9 M compared to 3.0 M in Version 3.
Of the Underserved locations in Version 3:
• 260 K moved to unserved in Version 4
• 675 K moved to served in Version 4
• 930 K dropped in Version 4
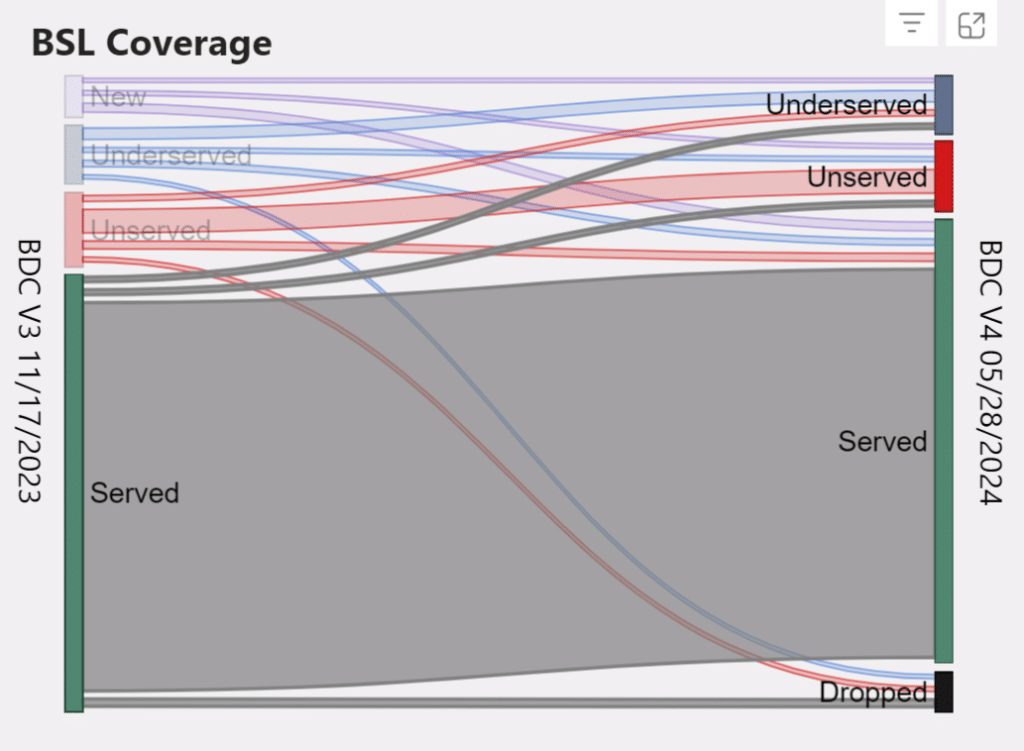
Served
In Version 4, there are now 106.8 M served locations compared to 105.1 M served locations in Version 3.
Of the Served locations in Version 3:
• 267 K moved to unserved in Version 4
• 232 K moved to underserved in Version 4
• 929.5 K were dropped in Version 4
Results Summary