For some, acquiring granular and reliable broadband data to effectively inform broadband initiatives has been a challenge. This is why using our core Broadband Serviceable Location data, we created the NetworkPlan dataset to provide complete and precise data for effective broadband network planning and design. Comes complete with coordinates, addresses, and other insightful data attributes such as Service Availability, Cost and Economics, Engineering and Construction, Demand and Demographics, and MORE per location. Data is available for all U.S. counties, states, and territories.
BroadbandFabric NetworkPlan Data Suite
BroadbandFabric NetworkPlan – kickstart broadband deployment projects with the most granular and precise broadband data possible. The broadband data in the BroadbandFabric NetworkPlan is based on CostQuest’s Broadband Serviceable Location data tied directly to federal broadband initiatives.
STRONG FOUNDATION OF LOCATION-LEVEL DATA TO SHOW USER LOCATIONS
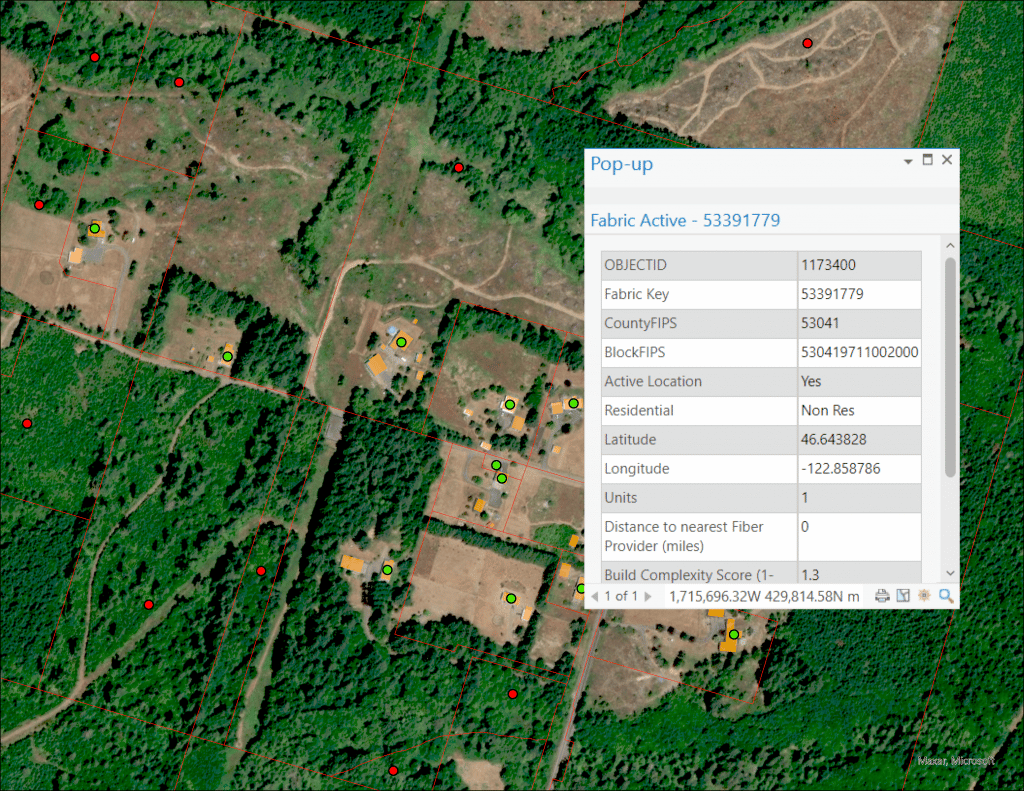
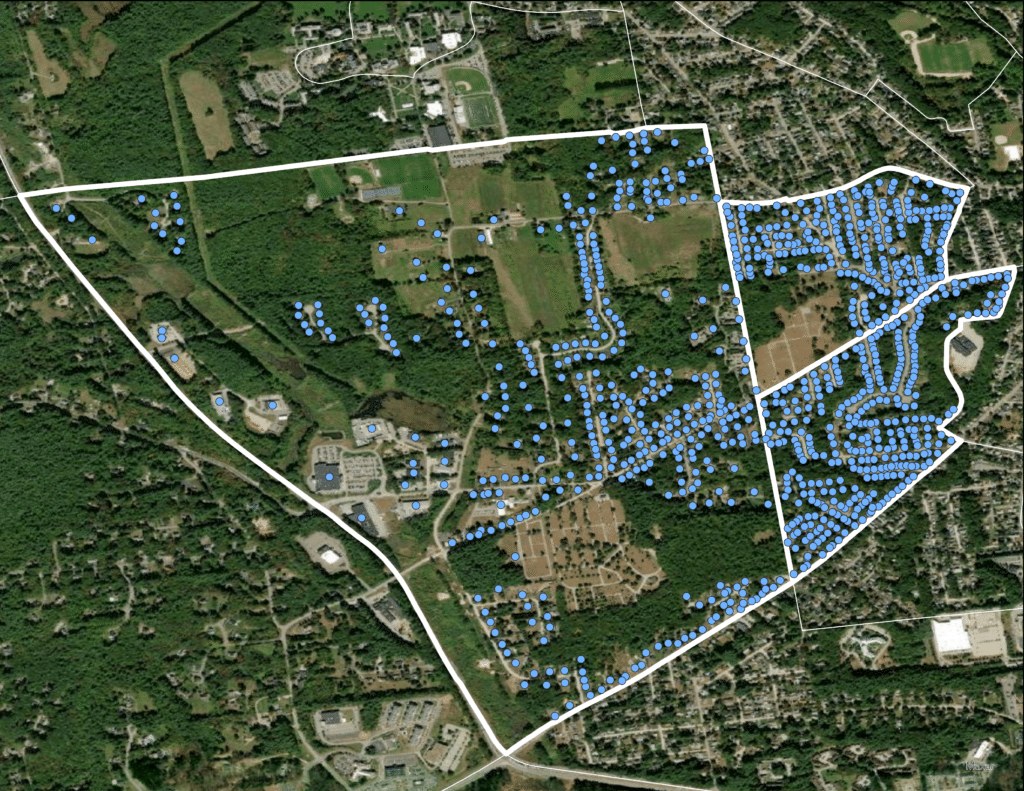
Each dataset contains a core base of Broadband Serviceable Locations that provides you with the coordinate-level granularity needed to identify end-user locations, and assist in qualifying whether they currently receive, can receive, or need broadband service. This data allows you to better understand the exact geographic placement of locations, their address, the number of users, and other essential insights per location.
RELIABLE INFORMATION FOR EFFECTIVE DECISIONS & SUCCESSFUL PLANNING
To make intelligent and effective decisions, it’s critical to have reliable information that guides you in the right direction. Every location can be tied to insightful information such as Service Availability, Engineering and Construction, Costs and Economics, and Demand and Demographics data you can rely on to guide you toward precise broadband decision-making.
BUILT BY BROADBAND & DATA SCIENCE EXPERTS YOU CAN RELY ON
Federal agencies, service providers, and other stakeholders, rely on CostQuest’s models and expertise to inform critical broadband initiatives and reform policies. CostQuest’s financial models and Broadband Fabric data, used by the FCC and NTIA, supports the Broadband Data Collection, BEAD, and other funding programs. Our work is reviewed regularly, withstanding the highest levels of scrutiny to ensure the work is foundationally sound.
Data Included
Expand the box below to see the data fields included. Click on the data category to see its description. Data is available for every U.S. state, territory, and county.
Includes all Active Locations and federally defined Broadband Serviceable Locations, their coordinates, addresses, unique Location_ID, building types (residential, business, CAI, etc.) units, land use, Hex 3 identifier, etc.
Active Locations represents ALL locations that have been determined to be broadband serviceable – a structure where broadband service can be installed.
Broadband Serviceable Locations (BSLs) represent locations that fall under the federal definition of a Broadband Serviceable Location.
Service Availability data of all Broadband Serviceable Locations. Includes technology (Fiber, Licensed and Unlicensed Fixed Wireless, Telco, Satellite, Cable), carriers, speed, a label if a location is considered unserved, underserved, and served, etc. Includes both BDC and NTIA Service Status.
BDC Service Availability Status represents the highest speed tier available per Fabric location from the FCC Broadband Data Collection (BDC) program:
1, Served – broadband speed greater than 100 Mbps download x 20 Mbps upload
2, Underserved – broadband greater than 25 Mbps download x 3 Mbps upload but below Served
NTIA Service Availability Status represents locations that are served, underserved, and unserved based on the NTIA’s established service level requirements (excluding Unlicensed Fixed Wireless and Satellite, etc.):
1, Served – Access to a low-latency Fiber, Cable, Copper, or Licensed Terrestrial Fixed Wireless offering of speeds greater than or equal to 100 Megabits per second (Mbps) download and 20 Mbps upload, or 100/20 Mbps (download/upload).
2, Underserved – Access to more than 25/3 Mbps, but without access to broadband service offering speeds of 100/20 Mbps (download/upload).
3, Unserved – Without any Terrestrial Broadband Service or with internet service offering speeds below 25/3 Mbps (download/upload) or latency less than or equal to 100 milliseconds.
Sourced from the FCC Broadband Funding Map, this data includes a label of which locations have been awarded federal funding – what program and awardees. Programs include: RDOF, CAF, etc. and will include BEAD.
A flag indicating whether a location that falls under an existing federal funding program is covered or uncovered with funding, and with residential or business services using licensed fixed wireless or wired technologies (i.e., Copper, Cable, Fiber to the Premises, Licensed Fixed Wireless, or Licensed-by-Rule Fixed Wireless) with speeds of at least 25/3 Mbps or 100/20 Mbps.
U indicates opportunity = A location does not have access to speed tier.
Fiber Cost Model – Greenfield and Brownfield FTTP network builds, includes:
Access Investment – Provides investment to acquire, engineer and install a fiber access network.
Success Based Investment – Captures investment for Optical Network Terminal (ONT) and drop at the Fabric Location. This is the investment associated with connecting a specific customer location to the fiber network. Also referred to as success based investment.
NPV – The Net Present Value of a 20-year cash flow accounting for revenue, operating expense (network specific, non-network specific, customer operations, bad debt, and general administration), capital expenses (income tax and replacement capex), and initial capex with discount rate of 8.5 percent. Fiber network design assumes a carrier agnostic network.
Fixed Wireless Cost Model for Greenfield and Brownfield network builds, includes:
Access Investment – Provides investment to acquire, engineer, and install a new Fixed Wireless broadband network.
Success Based Investment – Captures investment for Fixed Wireless materials and labor at the customer premises: router, antenna, cabling, etc. This is the investment associated with connecting a customer location to the fixed wireless network. Also referred to as success based investment.
NPV – The Net Present Value of a 20-year cash flow accounting for revenue, operating expense (network specific, non-network specific, customer operations, bad debt, and general administration), capital expenses (income tax and replacement capex), and initial capex with discount rate of 8.5%.
This data value provides the Wireless 5G cost profile for the area the Fabric Location resides in. Indicates whether a location falls in an area that is in the highest to lowest cost range of the country.
As examples: a value of 10 means the location falls in an area that is in the lowest 10% of the country; a value of 75 means the location falls in an area where the cost is in the highest 75% range of the country.
Residential and Non-Residential Fiber Take Rate (Market Share):
An estimate of the projected market share that a new fiber entrant will experience with residential and non-residential customers in the area. The rate takes into account the level and type of competition.
A complexity score for each location for greenfield and brownfield fiber network builds. The scoring value incorporates linear density, terrain, cost differentials, large area density, distance to a central core, and other factors.
Includes residential and business demographics such Avg HH Size, Median income, Education, Age, Linear density of Fabric location per road and square mile, tower count, etc.
Includes the number of Fabric locations identified as NonK12Schools, Medical, Library, Government, Non Government, Public Safety, K12Schools, EB (College Campuses, Military bases and Prisons, etc.).
What can I use BroadbandFabric NetworkPlan data for?
Planning
Develop Network Plans
BroadbandFabric NetworkPlan data contains Broadband Serviceable Location data layered with insightful information per location you can import into your GIS to create a geographically granular and comprehensive broadband map. This collective data displayed in your broadband map allows you to assess a location’s broadband service availability, competitive landscape, residential and non-residential demand, federally funded areas, demographics, and identify nearby Community Anchor Institutions. Each location is layered with crucial information per location to help you make the most informed decisions from your broadband data.
With the BroadbandFabric NetworkPlan data, you receive an estimated cost to serve each location with Fiber and Fixed Wireless technologies. Unlock data to understand broadband service availability, cost investment per location, federally funded areas, competitive landscape, residential and non-residential demand, demographics, and the location of nearby Community Anchor Institutions. NetworkPlan data can help you develop confident cost estimates, so you can be successful when competing for funding opportunities (ex. IIJA’s BEAD funding program) and mitigate risks in the process.
Planning
Build Fiber Business Case & FTTP Design
With the BroadbandFabric NetworkPlan, you have the option to add on Business Case and Fiber Network Design data to view fiber routes and analyze the market opportunity for a typical Fiber to the Premise (FTTP) buildout. Indicate a defined service area, and we will deliver NetworkPlan Fiber data along with data from CostQuest’s Fiber Business Case, which includes the cost to maintain the business over time, plus an estimate of demand, revenue, and the Net Present Value of the full network business. The final output provides a clear picture of what subsidies are needed, eligible funding areas, and infrastructure routes. Fixed Wireless network models can also be modeled for a Full Business Case.
Planning
Identify Grant Opportunities Faster
The data collectively in the BroadbandFabric NetworkPlan dataset allows you to assess Broadband Serviceable Locations, broadband service availability, cost, infrastructure, and federally funded areas all in one view. This dataset, along with a Full Business case and Network Design, can accelerate the identification and assessment of opportunities to pursue.
Planning
Deployment Validation
The BroadbandFabric NetworkPlan dataset provides teams with coordinates of all Broadband Serviceable locations within a defined geographic area. Overlaying the awarded funding areas with this rooftop-level location data enables precise buildout plan tracking, field verification, or remote visual verification using satellite and street side imagery.
Planning
Reporting Obligations – USAC HUBB
Use this data for your semi-annual and grant program regulatory filings for the USAC’s HUBB. This data is formatted to meet USAC’s filing requirements, so you can easily integrate it with your existing data to create filings.
Get broadband-specific data intelligence
With over 115+ million locations identified, each location represents either a residential, business, community anchor institution, governmental, and agriculture structures where a broadband connection is or can be installed. With the option to tie more broadband-specific attributes to each location that is built by broadband experts to enhance the analysis of each location to better support network planning, opportunity assessments, location qualification, policy, regulation, and sales and marketing broadband initiatives.
Confirm geographic accuracy
BroadbandFabric datasets, except for CBG Ops Assessment, provides the exact geographic placement of each location, by first pinpointing structures of locations through highly accurate latitude and longitude coordinates, then using visual verification methods for added confidence.
Universal Location IDs compatible with federal programs
The Location IDs for the Broadband Serviceable Locations in all the BroadbandFabric Data Suites align with the Location IDs in the FCC’s Broadband Serviceable Location Fabric for the Broadband Data Collection and National Broadband Map programs. These locations also align with the data used for select federal broadband funding programs.
Easy import & interoperability with other datasets & applications
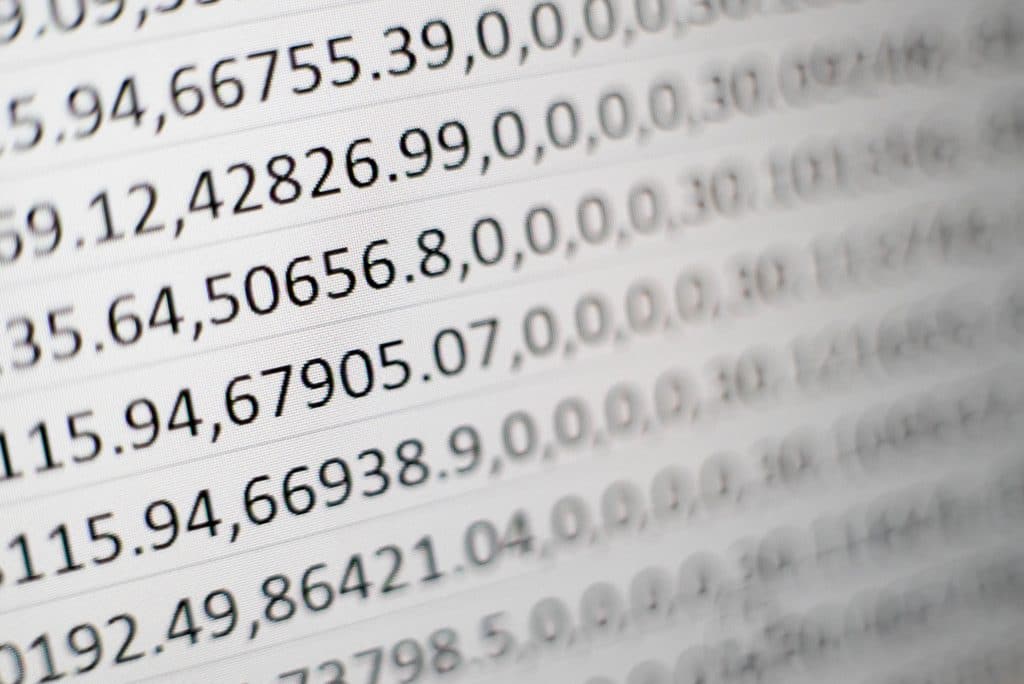
All BroadbandFabric datasets come in a .CSV file format that can easily import into any major GIS or visualization software, network planning tools, SQL, or related applications. This data integrates easily with other data by using a unique location ID, which is a universal location identifier that can support aligning other datasets with the locations in the BroadbandFabric data.
Custom data you can add on
Custom Fiber Business Case Data
The custom Fiber Business Case data provides users with comprehensive financial data that provides accurate cost estimates and revenue projections for broadband professionals to precisely understand the full market opportunity for deploying a typical Fiber to the Premises (FTTP) network buildout to a defined service area, the success-based capital needed, Net Present Value, identify where funding is most required, and the cost to maintain the network business over time.
This data provides you with a full Fiber Business Case for a custom geographic area.
Users indicate their defined service area, and we will deliver custom Business Case data for that area.
The full Business Case includes the cost to maintain the business over time, plus an estimate of demand and revenue, and success-based capital.
The custom Business Case also provides users with the Net Present Value look of the potential service area. With this information, users can understand the full market opportunity for deploying a typical Fiber to the Premises (FTTP) network buildout to a defined service area and identify where funding is most required.
Click the button below to learn more about CostQuest’s custom Fiber Business Case Model data.
Custom Fiber Network Design from our CQA Autodesign model
This data includes fiber routes to Broadband Serviceable Locations (demand) and logical placements of equipment along the way.
We also will provide you with an efficient clustering and a full GIS design output ready for approval from a Professional Engineer.
Broadband-specific, precise and simple
After 20+ years of broadband planning, economic network modeling, and mapping, we understand the challenges that come with limited access to quality and granular data. The BroadbandFabric NetworkPlan dataset was created with a simple aim – to deliver a broadband-specific, precise, and simple data solution to provide reliable support for various business planning, broadband deployment, network design, policy, regulation, and reporting challenges due to lack of reliable data.
Receive data in 3 easy steps
Step 1
Request sample data
Select “Get started today” located at the bottom of this page. Fill out the “Contact Us” form and indicate you would like a sample in the comments field. Then, one of our sales representatives will reach out and set you up with a sample county.
Step 2
License the data you need
When you’re ready, license the data for your areas of interest and receive data via a secure portal. Choose a 1, 2 or 3 year license duration, with a minimum order size of a US County.
Step 3
Import-ready data files are delivered securely
We’ll deliver the BroadbandFabric data files via a secure portal, in .CSV file format for you to upload into any major GIS, SQL, or software of your choice. All orders come with access to our customer success team, to ensure you have what you need to be successful with the data.
Trusted by your peers in telecom
CostQuest works with service providers, and governments – federal, state, and local. While we’re most known for our work with the FCC, we work with providers and governments of all sizes. The listed states are currently using CostQuest’s data in their broadband programs.