CostQuest’s Broadband Serviceable Location Fabric (BroadbandFabric) Data is a database of over 115 million individual location structures where a broadband connection is or can be installed. CostQuest refers to these locations as “Broadband Serviceable Locations.” All Broadband Serviceable Locations include residential, business, multi-dwelling, CAI, agricultural, and other location types. This dataset ties easily with other data layers using a universal unique location ID, and aligns with the National Broadband Serviceable Location Fabric dataset used for the Broadband Data Collection, National Broadband Map, and other federal programs.
CostQuest’s Broadband Serviceable Location Fabric Data
The Broadband Serviceable Location Fabric dataset comes in an Excel .CSV file format and can be imported into any major GIS application, network planning software, SQL, or other related applications. Built by broadband experts and blended with machine learning, the Broadband Serviceable Locations dataset is built to be the perfect guide for broadband deployment, business planning, and policy decisions.
STRONG FOUNDATION OF LOCATION-LEVEL DATA TO SHOW USER LOCATIONS
Reliable information for effective decisions & successful planning
BUILT BY BROADBAND & DATA SCIENCE EXPERTS YOU CAN RELY ON
Data Included
Expand the box below to see the data fields included. Click on the data category to see its description.

How CostQuest Identifies Broadband Serviceable Locations
To get pinpoint accuracy for all locations, CostQuest categorizes as Broadband Serviceable Locations; the team aggregates hundreds of millions of data points, applies statistical scoring, and managed crowdsourcing to identify the precise locations of virtually every structure that is a candidate for broadband.
Step 1: Start with a Geographic Frame of Reference
When looking for Broadband Serviceable Locations (BSLs), CostQuest starts by obtaining rich geospatial information across all 50 states and territories to create a geographic frame of reference to start the analysis. CostQuest uses parcel information to create the geographic frame of reference, or the “sandbox” to work from, to provide boundaries of where to look for a structure/building within a piece of geography. CostQuest then ties in additional data sources to further the team’s understanding of the land and building use within each geographic frame.
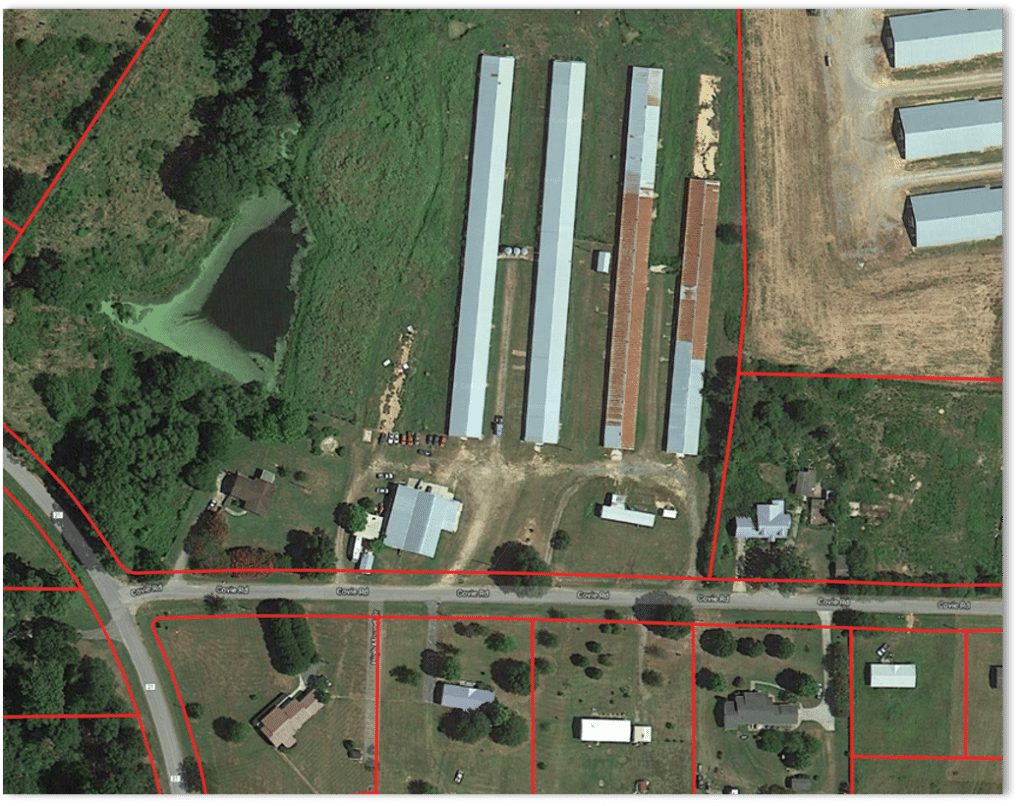
The red lines represent geographic frames of reference a.k.a. parcel boundaries.
Step 2: Link County Tax Assessor Information
County Tax Assessor attributes provide more details about a piece of geography – what it is used for, the address, the value of the property and any building on it, and more. By analyzing the tax attributes of each geographic frame of reference, CostQuest can isolate characteristics at a location level. Statistical scoring is used to systematically consider each attribute to answer a question: is this piece of geography likely to contain a structure that may require broadband service or a technical term CostQuest calls a Fabric Active structure?
Step 3: Connect Geographic Frames and Tax Assessor Information with Building Footprints
CostQuest then uses building footprints to look at all the possible buildings within each geographic frame of reference. These footprints give CostQuest the geospatial coordinates of each structure on that individual piece of property.
What CostQuest derives from the tax assessor attributes is then compared to what is seen in the building footprints. Rooftop detail, size, and building shape help us determine which building is the likely point where broadband service will be accessed. The structures are visually identified and assessed for confidence.
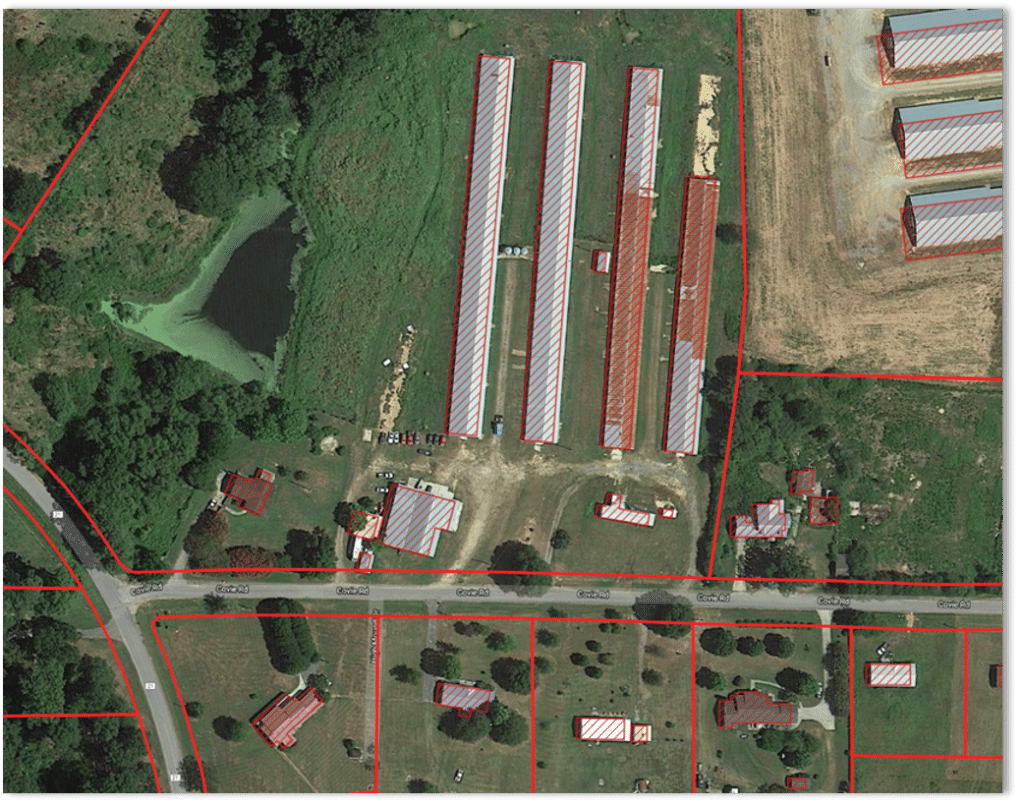
The red-shaded shapes above each location structure represent the building footprint.
Step 4: Connect other data sources
A. CostQuests connects additional data sources using a universal location identifier tied to each Broadband Serviceable Location to help inform the model as to which location structures are candidates for broadband. The data sources are updated semi-annually. All the data sources include:
- Parcels
- Satellite Imagery
- Commercial building footprints
- Tax Attributes
- Address datasets
- Road Segments
- US Census
B. More data can be linked to the locations to learn more about specific areas of interest. For example, broadband service availability, deployment cost information, federally funded locations, build complexity, demographics, and the competitive landscape.
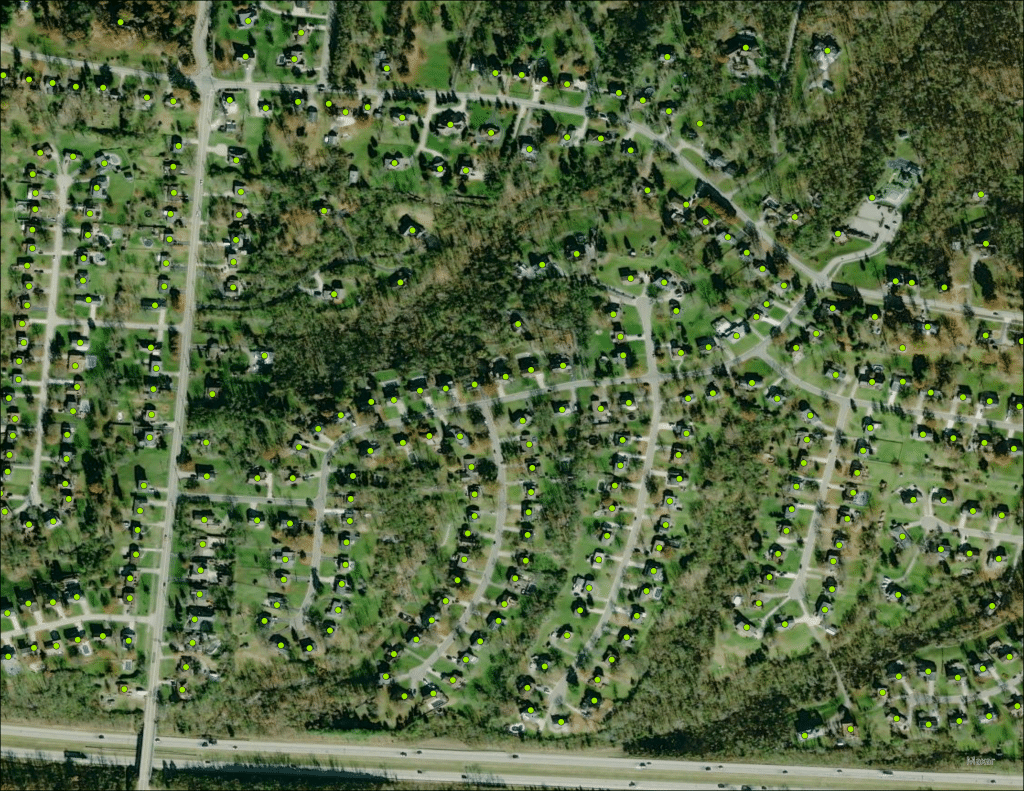
Step 5: Identify Broadband Serviceable Locations
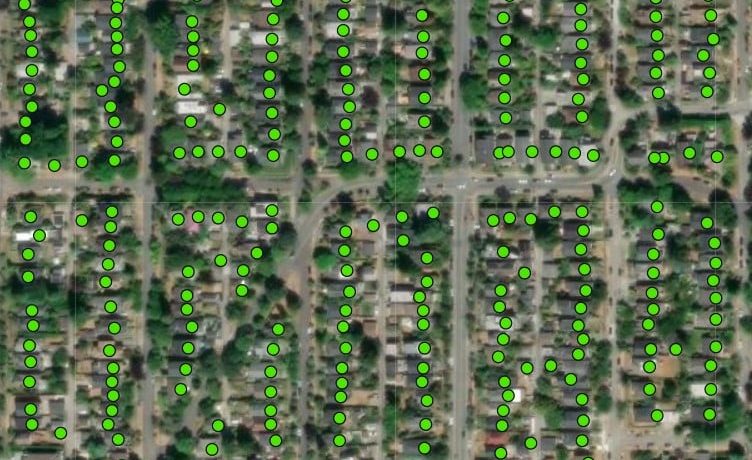
Final Result: Using conditional logic, CostQuest sets rules that connect building footprints from aerial imagery, tax attributes, road segments, U.S. Census, parcels, addresses, land cover data, and more to pinpoint and display the precise coordinates of each Broadband Serviceable Location (structure) that is the likely point where broadband service will be accessed.

The circled locations with a green dot represent the identified Broadband Serviceable Location in each geographic frame of reference.
Step 6: Human Visual Verification
Visual verification is an internal process CostQuest uses to have human beings review locations that our models aren’t confident in. This step is critical in adding human oversight to improve machine learning in selecting the appropriate location structure within a geographic frame.

The circled locations with a green dot and check represent the identified and visually verified Broadband Serviceable Location in each geographic frame of reference.
Custom data you can add on
Your complete location guide for essential business operations
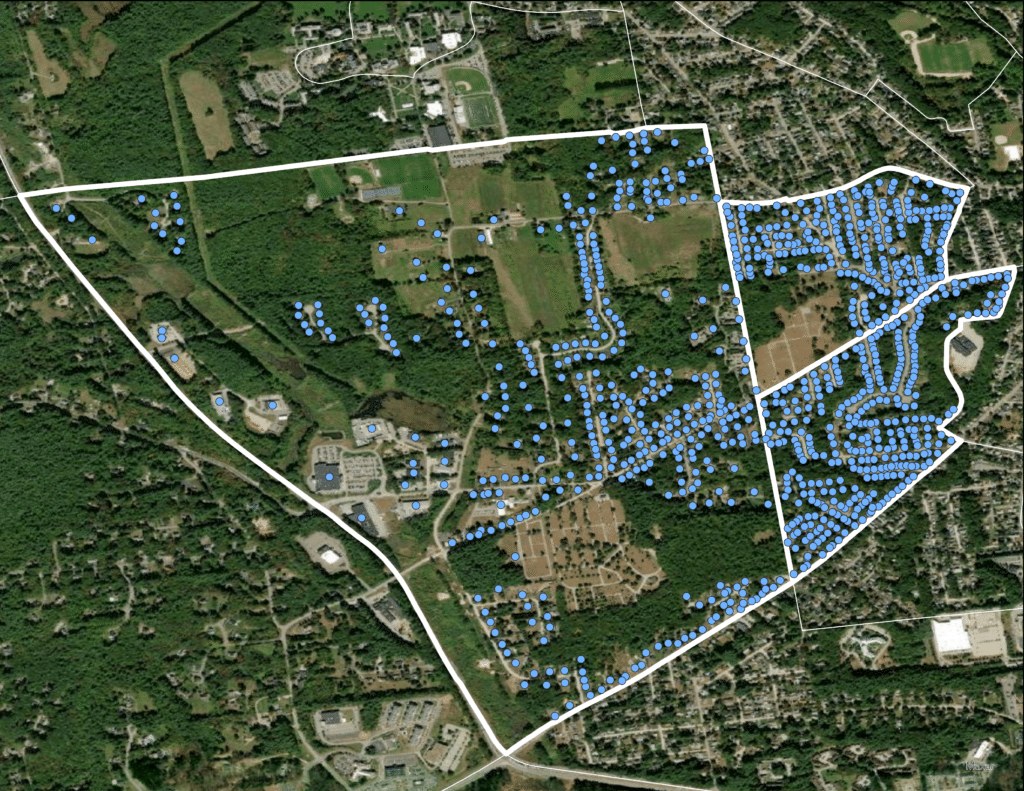
You can leverage the Broadband Serviceable Location Fabric data to support a multitude of business functions, such as building a broadband availability map, informing network plans, designs, financial modeling, managing a broadband program, funding determinations, opportunity assessments, regulatory filings, aligning billing systems, and more. What the Broadband Serviceable Location Fabric data looks like in a Geographic Information System (GIS). The green points represent Broadband Serviceable Locations.

Get broadband-specific data intelligence
Confirm geographic accuracy

Universal Location IDs Compatible with Federal Programs

Easy import & interoperability with other datasets & applications
Receive data in 3 easy steps
Step 1
Request a sample
Select “Get started today” located at the bottom of this page. Fill out the “Contact Us” form and indicate you would like a sample in the comments field. Then, one of our sales representatives will reach out and set you up with a sample county.
Step 2
License the data you need
When you’re ready, license data for your areas of interest and receive data via a secure portal. Choose a 1, 2 or 3 year license duration, with a minimum order size of a US County.
Step 3
Import-ready data files are delivered securely
We’ll deliver the BroadbandFabric data files via a secure portal, in .CSV file format for you to upload into any major GIS, SQL, or software of your choice. All orders come with access to our customer success team, to ensure you have what you need to be successful with the data.