
By: Hailey Farrow, Marketing Manager & Mike Wilson, VP on behalf of CostQuest Associates.
The success and quality of your broadband plans hinge upon the quality of the underlying data used to guide your decisions. This is why it’s critical to feed your broadband map and broadband planning decisions with geographically accurate and insightful data that gives you a clear picture of the broadband needs across your region or state. Thus effectively guiding the subsequent analysis and decisions sourced from the data.
To help you (states, ISPs, engineers, consultants, etc.) be successful in crafting broadband plans, maps, and maximize funding resources, to serve the most unserved and underserved areas as possible, here are some suggestions on what data you should obtain for your broadband maps:
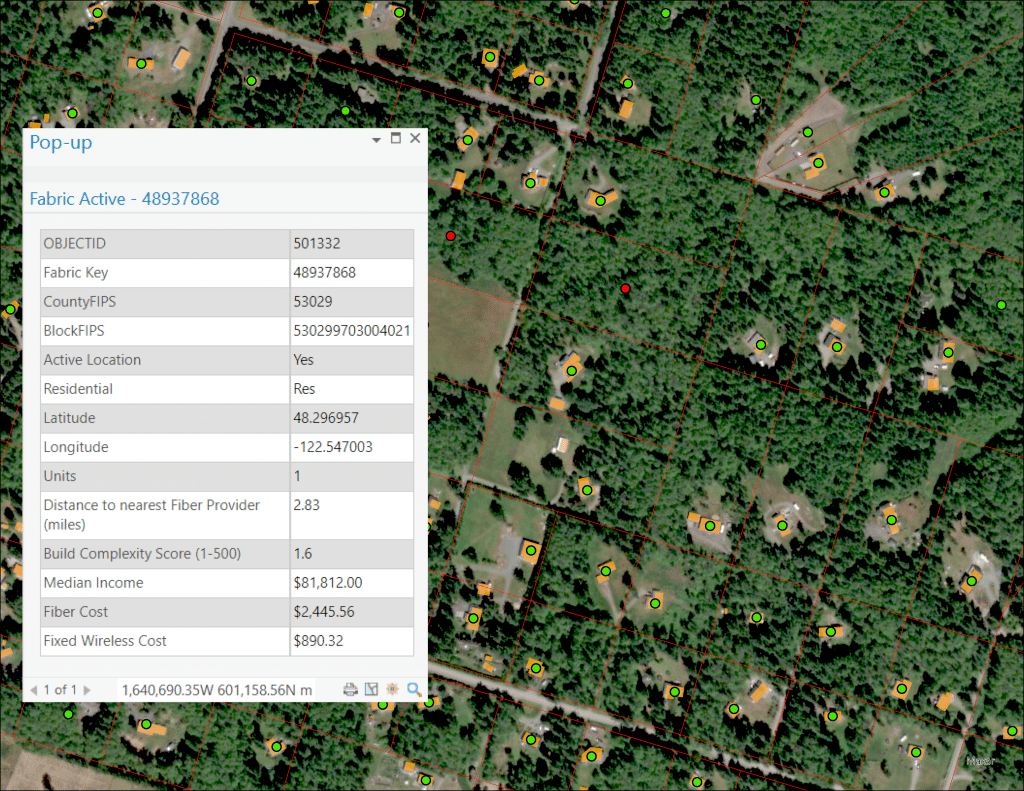
- Broadband Serviceable Location data: The geographic coordinates (exact placement) of all structures, including residences, businesses, CAIs, etc., where a broadband connection is or can be installed. Use the FCC definition of a Broadband Serviceable Location if you’re looking for locations that are or will be covered under federal funding programs.
- Broadband service availability & estimated units in demand: Where is broadband service likely or less likely to be available below the census block level, with what type of broadband technology, and how many serviceable locations are considered unserved and underserved with broadband?
- Competitive landscape: How many, and what type of technology providers are within a certain proximity of a Broadband Serviceable Location?
- Build Complexity: Relative difficulty in deploying Fiber to a serviceable location. Understanding factors such as soil, terrain, and labor conditions are key.
- Service adoption: Understanding what to expect in terms of broadband adoption for a serviceable location, and the factors that contribute to lower adoption rates.
- Cost to deploy: Fiber and Fixed Wireless costs to deploy and serve a location.
- Available Funding: Understanding what funding programs are already or going to be made eligible to help subsidize the cost of deploying Broadband Serviceable Locations.
- Location Demographics: Get more information about the people at each location. Such as the average household income and average household size to further understand the potential adoption of a particular broadband service and see if there are affordability concerns. For example, low household income + plus no access to a computer or other electronic devices = may be less likely to need or afford internet services.
*Note: All of this data is available within CostQuest’s BroadbandFabric data. Each layer of data is tied to a Broadband Serviceable Location at the coordinate level.
The data you obtain for a broadband map & broadband plans should help answer the following questions:
- Where and how many exact locations are served and underserved with broadband service?
- What providers are able to provision service, and where are their existing coverage areas?
- Are there any protected areas that require a special permit and topographical factors that could affect broadband infrastructure deployment?
- Are there any barriers to the adoption of the deployed broadband services?
- What will the lifetime cost of this network deployment project be?
- Does this location qualify for other funding programs such as CAF II, RDOF, or the Capital Projects Fund?
Why do you need this data to develop effective broadband plans, designs, investment models, grant proposals, etc.?
Comprehensive, granular, and reliable broadband information embedded into a region or state-wide broadband map is crucial to effectively inform how to invest, plan, and design a broadband network as effectively as possible.
It is important to note that “the success and quality of your planning hinges upon the quality of the underlying data used to guide decisions.” Jim Stegeman, President & CEO of CostQuest Associates.
First, it is critical to categorize areas on a location-by-location basis in a state or region broadband map to reflect the exact geographic location of structures that may require a broadband connection (Broadband Serviceable Locations).
This granular view of location information allows teams to overlay service availability and other information upon these locations, so a map at the least represents the exact geographic placement and the number of served, unserved, and underserved locations in a given area. You can then plan accordingly, and guide investment, network design, and other broadband planning decisions based on a valid base of information that reflects the broadband needs across your region or state.
Second, it’s highly recommended that your broadband planning decisions are informed by data that provides you with a reliable picture of broadband service availability, competition, network build-out complexity, deployment costs, funding eligibility, and broadband adoption.
A collective understanding of the needs and barriers facing each location allows you to conduct a robust analysis based on a comprehensive set of information that reflects the required investment, competitors in the area, potential build-out challenges, adoption, and affordability barriers to unserved and underserved locations. The more comprehensive and accurate the information you obtain in your broadband map, the more effective decisions will be when crafting investments, business cases, grant proposals, network plans, designs, and beyond.
With comprehensive, granular, and reliable data providing you with the essential information on unserved and underserved areas, you will also be able to generate plans that align with the priorities and requirements of grant programs, produce a reasonable fair investment to propose and allocate, and of course, serve as many underserved and unserved areas as possible. While also mitigating risks in the process by addressing factors that may affect the deployment and adoption of broadband services in a specific area. Again, the better data you have, the better your decision-making will be. You don’t want your data to lead you in the wrong direction.
Here’s an example of data in a broadband map that could mislead decision-making:
In Figure 0.2, we see a GIS application that displays locations on a broadband map based on an address. This address data set (red dots) marks locations along road segments, but the actual serviceable structures (green dots – structures where a broadband connection can be installed) are approximately 100 meters away from where the address-based data set shows where that location structure is.
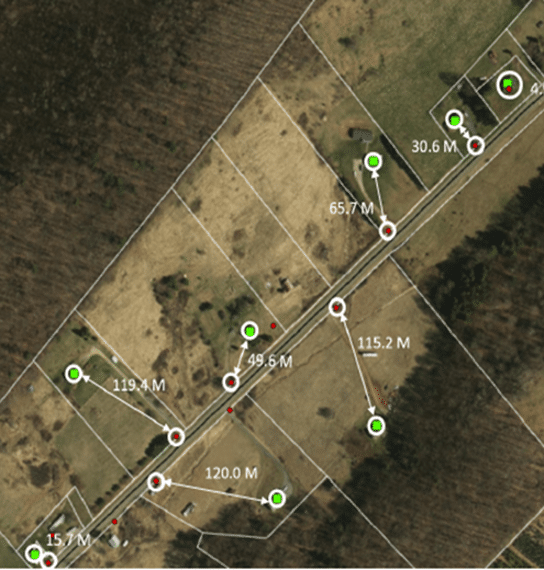
Using address-based geocoding instead of identifying serviceable structures through coordinates, is one way to potentially mislead decision-making when broadband planning, including project investments (material + labor), and build-out timelines. Broadband Equity, Access, and Deployment (BEAD) grant applications and other funding bids are more likely to be successful when you obtain reliable information about the overall conditions and broadband needs of the state or region that help lead you towards more precise estimations.
Final thoughts – Better data, better broadband plans
It is critical to feed your broadband map with geographically accurate and insightful data that gives you a clear picture of broadband access and needs across your region or state.
The quality of the data sets you use in your broadband map and inform your broadband plans, plays an essential role in the success of the subsequent decisions and plans you make. Especially if you are planning a broadband deployment or expansion project and/or applying for funding from BEAD and other grant programs.
Comprehensive, granular, and reliable broadband data enables you to conduct a robust analysis across your region or state and guides you in the direction that leads to effective plans and more broadband connections.